From an article on CityLab about how cost-of-living really mostly means cost-of-your-rent:

This is based on RPP, or Regional Price Parity. That’s a weighted statistic that tracks the different price levels of things like food, housing, etc. The data above is based on 2008-2012 and even though the stat is weighted, Jose Lobo at Arizona State pulled out the different effects on each specific area. Basically, the central tenet of the CityLab article is that when you talk about “cost of living,” you’re primarily talking about your rent — because some of the other key factors (like price of beef, etc.) are relatively consistent in different geographical areas. As we know, though, some places have much more expensive housing. To quote the article:
Honolulu, Hawaii has the highest cost of living, with an RPP of 122.9. This is not surprising, as it is on an isolated island where shipping costs effectively drive up the price of everything from goods to housing.
New York (122.2) is second, followed by San Jose, the hub of Silicon Valley (122.0), and Bridgeport, Connecticut (121.5)—which includes many high-end commuter suburbs of New York, as well as the finance center around Stamford. Next are Santa Cruz, California (121.4), San Francisco (121.3), and Washington, D.C. (120.4). The map appears blue and dark blue, indicating high cost of living, along the Northeast corridor and in Miami, parts of Texas, Chicago and Minneapolis in the Midwest, and California and Seattle along the West Coast. In contrast, many Midwestern Rustbelt metros and older, smaller places in the Deep South had RPPs below 90.
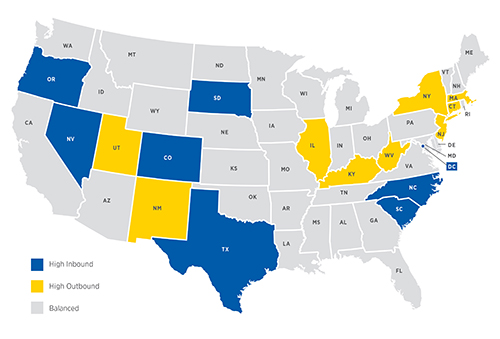
If you look at the map above and realize that “dark blue/blue is a lot of money” and “yellow/green is less money,” you’ll begin to understand why people are (somewhat) leaving the coasts for the middle-of-America cities. There are a lot of factors at play here — what the millennial generation seemingly wants from cities, for example, is likely more achievable in a less-dense place (such as a Colorado or a Texas) where cities can build out properly. In a place like a San Francisco, Boston, or Manhattan, there’s really not a ton of room left to do things like WalkUPs. There are also issues around social mobility — it takes a lot of money in a place like New York to make sure your kids’ existence is better off than your own — and how metropolitan areas that are too dense aren’t seen as favorably for raising children.
Bottom line is, the context is different for everyone. For some people, living closer to family is very important; you definitely see this in places like Minnesota. For others, living close to their core industry is important — hence people flocking to Los Angeles, San Francisco, New York, Boston, Houston (energy), or Miami relative to what they want to focus on (DC probably should have been higher on that list, since it’s essentially America’s No. 1 corporate town, with the corporation being “the federal government”). And for others, it is about perceived quality of life and raising of families, and if that’s the case, Utah and Colorado’s populations are about to explode. The answer is different for everyone, but when you really look at these research-oriented cost of living maps, you get a better feel for where the domestic migration trends of America might be headed in the next 15-20 years.
One Comment
Comments are closed.