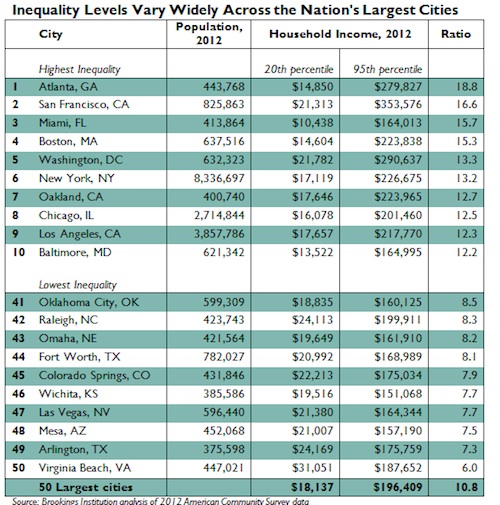
Here’s a new paper from the Brookings Institution looking at inequality — what the 20th percentile of earners in that city made in 2012 vs. what the 95th percentile made, and then calculating a ratio — in the 50 largest United States cities. Here’s the top 10 and bottom 10:
As you might expect, big coastal cities factor prominently in the “most unequal” part — San Francisco and Oakland are both represented, for chrissakes — and the “less unequal” part tends to have more inland cities, although VA Beach (the most equal place via 95-20 ratio among the top 50 cities in America, at least via 2012 data) is on there.
It’s not all a tragedy, though:
Growing debate about urban inequality suggests that the problem has gotten worse in recent years. But while inequality in cities is somewhat worse today than before the Great Recession, the trend is neither profound nor uniform. Overall, the 95/20 ratio across the 50 largest cities rose from 10.0 in 2007 to 10.8 in 2012. Not surprisingly, San Francisco experienced the largest increase in its ratio from 2007 to 2012. Income for its typical 20th-percentile household dropped $4,000 during that period, while income for its typical 95th-percentile household soared by $28,000. No other city saw nearly as large an increase in its rich households’ incomes.
But the issue is less about the rich getting richer, and more about the poor getting poorer:
“For instance, rich households in Jacksonville in 2012 earned nearly $19,000 (11 percent) less than five years prior. At the same time, incomes among the city’s poor households dropped nearly $8,000 (31 percent).”
This stuff does have broad policy implications, and also broad demographic implications: even if San Francisco and Miami are tremendous and beautiful places to live, there will come a breaking point where living there is impossible below a certain water-mark salary. If companies aren’t willing to pay that, well, less people will live there. That can shift where jobs are — and where they start to develop. And perhaps somewhat unsurprisingly, a good portion of the “most unequal cities” on the chart above tend to also fall in the “lack of social mobility” charts that have been released in the past six weeks or so. Essentially, the coasts and the American Southeast should scare you as a place to really develop a better life for your future generations. (Although they are getting more Google Fiber there.)


Simply desire to say your article is as astonishing. The clarity in your post is simply
excellent and i could assume you are an expert on this
subject. Well with your permission let me to grab your RSS feed to keep updated with forthcoming post.
Thanks a million and please keep up the gratifying work.